Algebra
|

|

|

|

|

|

|

|

|

|

|

|

|
Unit 3: Solving Inequalities

|

|

|

|

|

|

|

|

|
Lesson 3.1: How Do We Create Graphs to represent Inequalities?

(example 1)
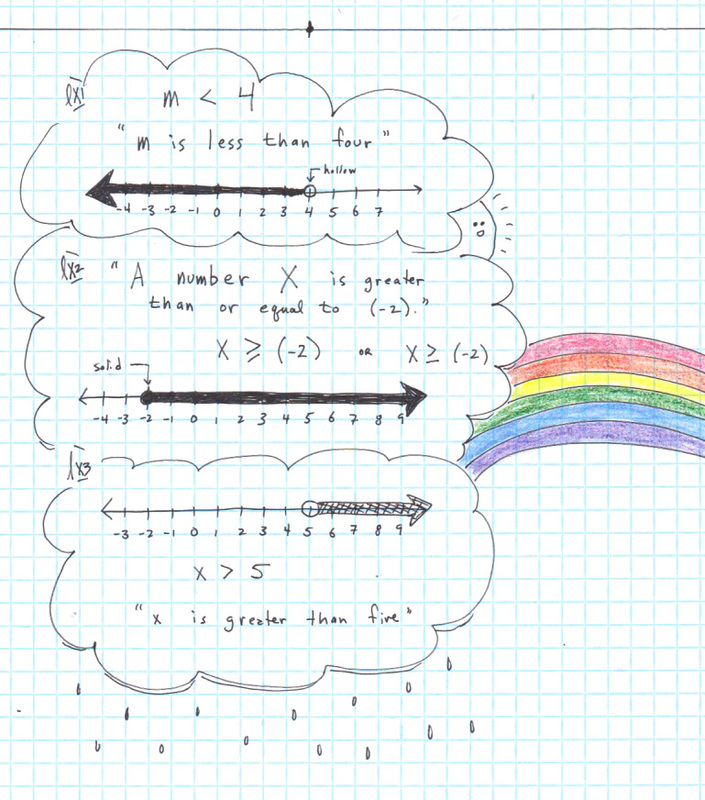
Consider the inequality
m < 4
What numbers are we talking about when we say, "m is less than four"?
Let's plot them all on a number line.
There's 3, of course.

There's 3, of course.
|

...and 2 and 1...
|

...and zero and all the negative integers...
|

...and the midpoints between all those numbers, all the halves or 0.5's...
|

...and 3.6 and 3.7 and 3.8 and 3.9 and 3.99 and 3.999 and 3.9999...
|

|
...but not 4. 4 is NOT less than 4. We signify that by using a hollow point at 4 itself. |
(example 2)
When we use the symbols ≤ and ≥ ,
we include another answer in the solution set.
We signify this by plotting a solid point on the number line.
|
x ≥ -7 |

|
It is important to note that this point is the boundary
of all the numbers that are greater than seven
and the ones that are not.
This will help our understanding
as we include more variables down the line.
Classwork & Homework:


